Collision avoidance technology is reshaping the auto collision industry, reducing accident frequency while simultaneously increasing repair complexity and cost.
Here’s a breakdown of how this shift is playing out:
Fewer Accidents, But Not Fewer Challenges
-
Accident rates are declining thanks to widespread adoption of Advanced Driver Assistance Systems (ADAS) like automatic emergency braking, lane-keeping assist, and blind-spot monitoring. These systems are proving effective in reducing rear-end collisions and lane-departure incidents.
-
Insurance data confirms the trend: Vehicles equipped with ADAS features show significantly lower claim frequencies, especially for minor fender-benders and low-speed impacts.
Fewer Repairs, But More Expensive Ones
-
Repair volumes are down, especially for older shops that rely on high-throughput, low-complexity work. This is particularly noticeable in urban areas where newer vehicles dominate.
-
Repair costs are up: Even minor collisions now involve recalibrating sensors, cameras, and radar systems. A simple bumper replacement can require $1,000+ in recalibration work.
-
Shops must invest in new tools and training to handle ADAS-equipped vehicles. This includes scan tools, calibration bays, and OEM repair procedures.
Strategic Shifts for Body Shops
-
Shops that adapt are thriving by offering ADAS calibration, pre- and post-repair scanning, and OEM-certified repairs. These services command higher margins and build trust with insurers and customers.
-
Consolidation is accelerating: Larger MSOs (multi-shop operators) are acquiring smaller shops that can’t keep up with the tech demands, creating a more competitive landscape.
-
EVs and lightweight materials (like aluminum and carbon fiber) are adding another layer of complexity, requiring specialized equipment and repair protocols.
Outlook: Fewer Dents, More Data
-
The industry is shifting from “panel beaters” to “tech centers.” Shops that embrace diagnostics, calibration, and digital workflow tools will be best positioned for the future.
-
Customer education and transparency are becoming key differentiators, especially as repair bills rise and insurance policies evolve.
Here’s a breakdown of the most recent data:
U.S. Traffic Fatalities: Year-over-Year Comparison
| Year | Fatalities | Change from Previous Year | Fatality Rate (per 100M VMT) |
|---|---|---|---|
| 2022 | 42,721 | — | 1.34 |
| 2023 | 40,901 | ↓ 4.3% | 1.26 |
| 2024 | 39,345 | ↓ 3.8% | Not yet finalized |
Sources: National Highway Traffic Safety Administration (NHTSA
What’s Driving the Decline?
-
ADAS technology (automatic emergency braking, lane assist, etc.) is reducing common crash types like rear-end and side-impact collisions.
-
Improved vehicle safety standards and crash avoidance systems are becoming standard even in mid-tier models.
-
Post-pandemic driving behavior has normalized, with fewer risky driving patterns (e.g., speeding, distracted driving) than in 2020–2021.
Injuries vs Fatalities
-
While fatalities dropped, estimated injuries rose slightly from 2.38 million in 2022 to 2.44 million in 2023—a 2.5% increase, though not statistically significant.
-
This suggests that while deadly crashes are declining, non-fatal accidents still occur frequently, possibly due to increased miles traveled or more congested urban driving.
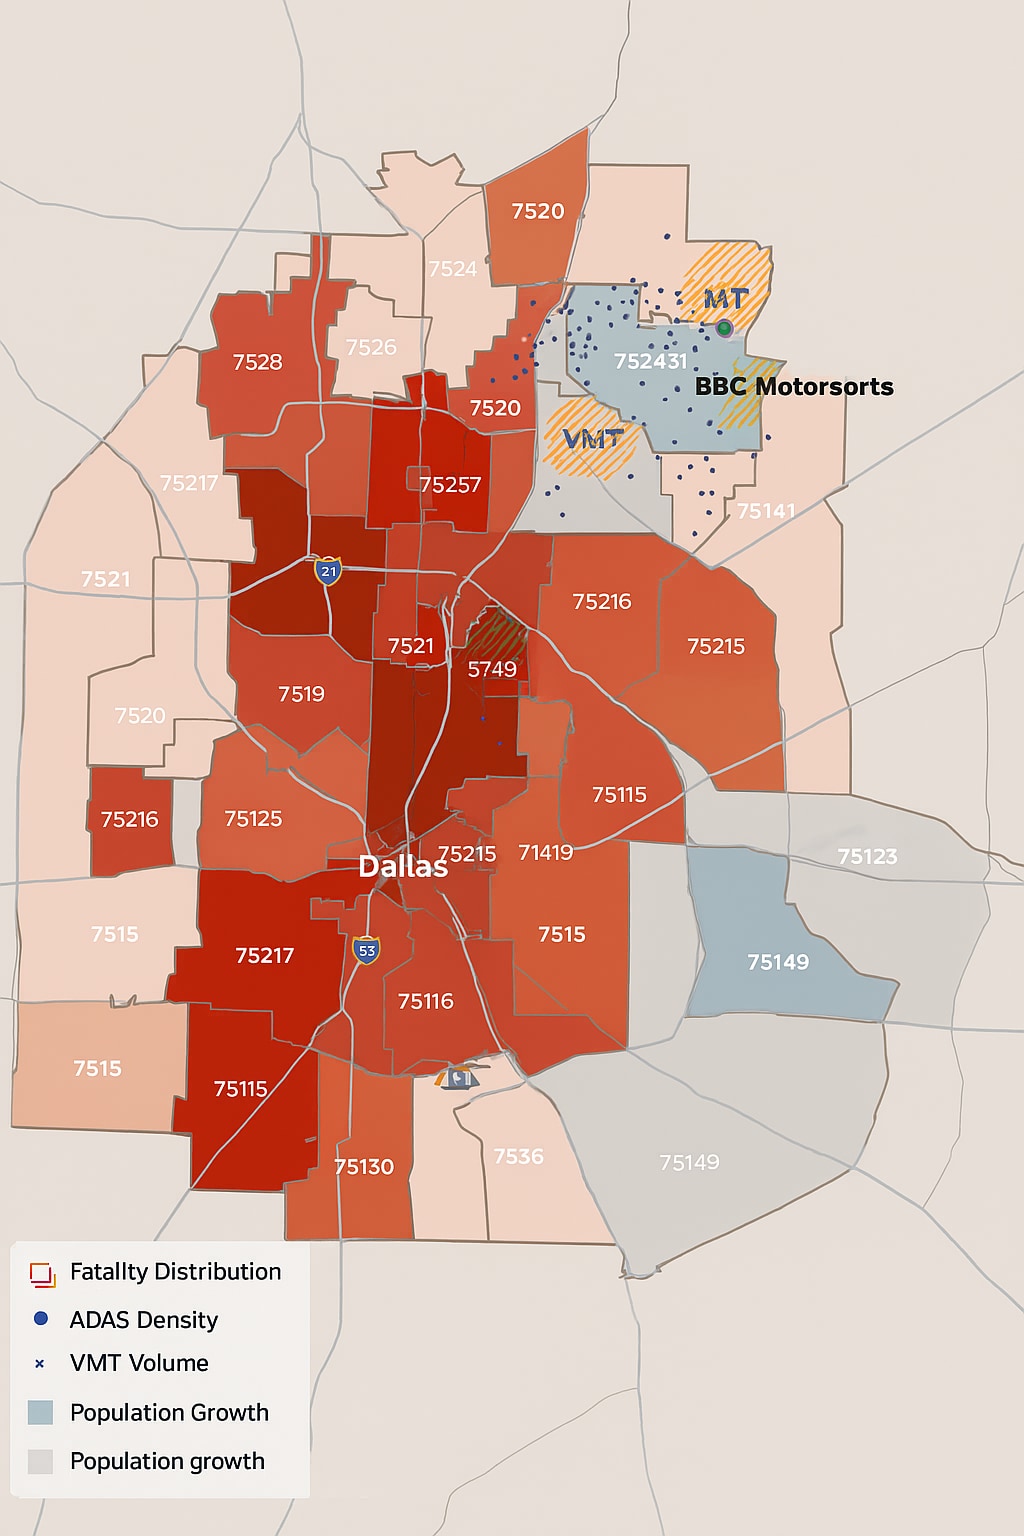
In Dallas, traffic fatalities increased slightly in 2024, with 207 deaths compared to 205 in 2023—a 1% rise, bucking the national trend of declining accident rates.**
Here’s a deeper look at what’s happening locally:
Dallas Traffic Accident Trends (2023–2024)
| Year | Fatalities | Change | Notes |
|---|---|---|---|
| 2023 | 205 | — | High rate despite safety initiatives |
| 2024 | 207 | ↑ 1% | Slight increase in deaths |
-
Dallas remains one of the deadliest cities for drivers among the top 15 U.S. metros, with a fatality rate higher than the national average.
-
Most dangerous intersection: I-635 & Skillman Street, averaging 256 crashes annually.
-
Contributing factors include high-speed corridors, poor road design, and a car-dependent culture that prioritizes convenience over caution.
Why Dallas Defies the National Decline
-
ADAS-equipped vehicles are increasing, but the overall fleet still includes many older models without safety tech.
-
Urban sprawl and congestion lead to more exposure hours and complex driving environments.
-
Driver behavior—including speeding, distracted driving, and aggressive lane changes—remains a major issue.
Implications for Collision Shops
-
Volume remains steady or slightly down, but repair complexity is rising, especially for newer vehicles with ADAS.
-
Shops near high-crash corridors (like I-635, Central Expressway, and LBJ Freeway) may still see consistent demand.
-
Calibration and diagnostics services are becoming essential, especially for shops serving newer fleets or insurance DRPs.
Here’s how those factors stack up:
Population Growth: More People, More Cars
-
Dallas County’s population surpassed 2.656 million in 2024, up from 2.62 million in 2023—a 1.4% increase.
-
The Dallas-Fort Worth metro area grew to 6.732 million in 2025, up from 6.655 million in 2024—a 1.16% increase.
-
This growth places Dallas-Fort Worth among the top 3 fastest-growing U.S. metros.
Implication: More residents means more drivers, more congestion, and more exposure hours on the road—even if per-capita accident rates are stable or declining.
Vehicle Miles Traveled: More Driving, More Risk
-
In 2023, the Dallas District logged 85.3 million daily vehicle miles on TxDOT-managed roads.
-
Preliminary 2024 data suggests a modest increase in VMT, consistent with national trends and urban mobility reports.
-
More miles driven typically correlate with higher accident exposure, especially in high-speed corridors like I-635, I-35E, and US-75.
Implication: Even with safer vehicles, more time on the road increases the likelihood of incidents—especially in areas with aggressive driving or poor infrastructure.
Why Fatalities Rose Despite Safer Tech
-
ADAS-equipped vehicles reduce crash severity, but they don’t eliminate risk—especially when mixed with older vehicles or distracted driving.
-
Urban sprawl and long commutes mean drivers spend more time on highways, where crashes are more likely to be fatal.
-
Infrastructure and behavior (e.g., speeding, lane weaving) still play a major role in Dallas’s accident profile.
Here’s a detailed breakdown of the local dynamics:
Population Growth: More People, More Cars
-
Dallas County’s population reached 2.656 million in 2024, up from 2.62 million in 2023—a 1.4% increase.
-
The Dallas-Fort Worth metro area grew to 6.732 million in 2025, up from 6.655 million in 2024—a 1.16% increase.
-
DFW was the 3rd fastest-growing U.S. metro in 2024.
Impact: More residents = more drivers = more congestion and exposure hours, especially in high-speed corridors like I-635 and US-75.
Vehicle Miles Traveled: More Driving, More Risk
-
In 2023, the Dallas District logged 85.3 million daily vehicle miles on TxDOT-managed roads.
-
Preliminary 2024 data from the Urban Mobility Report shows Dallas-Fort Worth VMT rose from 221.4 million to 231.3 million daily miles—a 4.5% increase.
Impact: Even with safer vehicles, more time on the road increases the likelihood of crashes—especially in areas with aggressive driving or poor infrastructure.
Fatalities: Holding Steady Despite Safer Tech
-
Dallas traffic deaths rose slightly from 205 in 2023 to 207 in 2024—a 1% increase.
-
This bucks the national trend, where U.S. traffic fatalities dropped 7.9% over the same period.
Why?
-
ADAS-equipped vehicles are increasing, but the fleet mix still includes many older, tech-limited vehicles.
-
Urban sprawl and long commutes mean more high-speed driving and more severe crashes.
-
Driver behavior—speeding, distracted driving, and lane weaving—remains a major issue in North Texas.
Strategic Takeaway for Collision Shops
-
Volume may not drop sharply in Dallas, but repair complexity is rising, especially for newer vehicles.
-
Shops near high-VMT zones (e.g., I-635, Central Expressway) can still expect steady demand.
-
ADAS calibration, diagnostics, and OEM certification are key growth areas as the fleet modernizes.